A successful project has at least one report. With reports, we can break down the overall data deliverables for a project into smaller chunks. For instance a project requiring a list of all McDonald’s locations in the United States can be split into reports for each state. The organization of the overall data into reports is driven by the customer’s need with Grepsr providing suggestions on best practices.
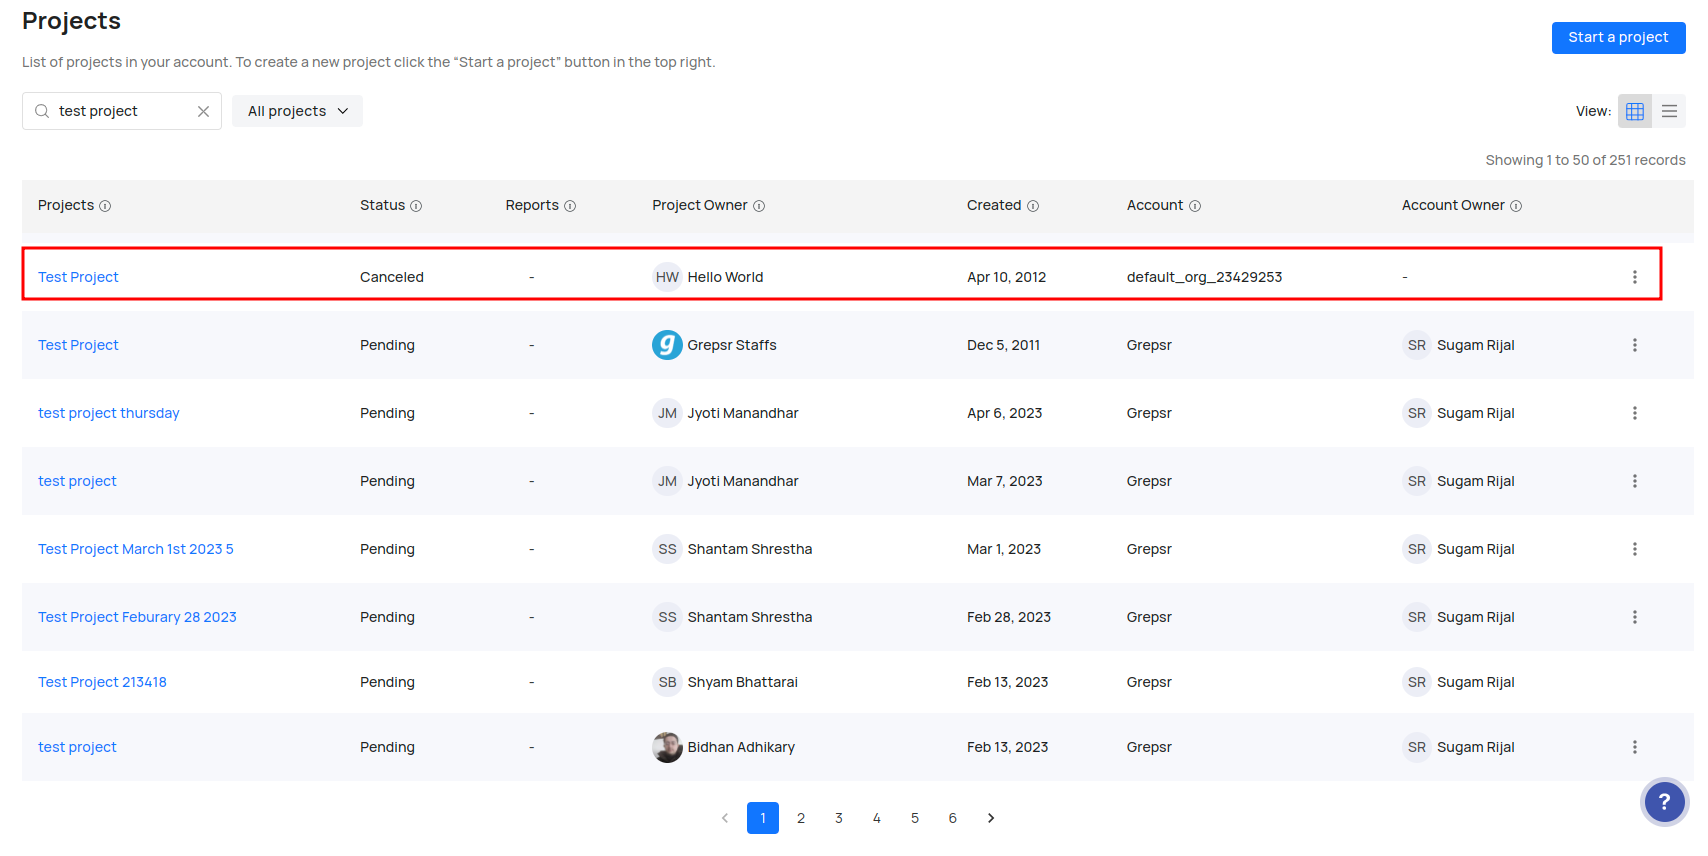
Fig: A project from a list of Projects
The number of reports available in each project is visible in the Projects list. To navigate to a specific report within a project
- Find the desired project from the list in the Projects page
- Click on the reports field which shows the count of reports in said project
- This will open a window with all the reports in the project. If your project contains several reports, then you can use the search box on top to find one you’re looking for
- From here you can navigate to a specific report which links to a page containing recent datasets
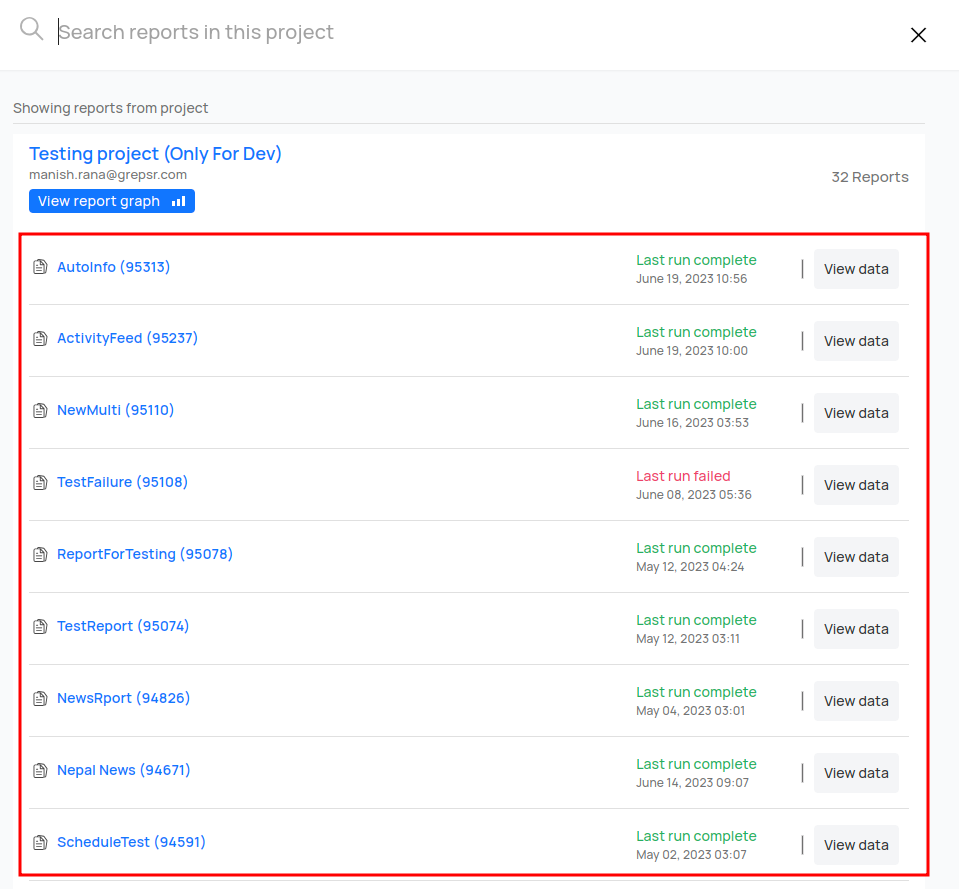
Fig: Reports in a project
💡View Report Graph
The “View report graph” button shows a bar graph containing the total number of rows generated in each of the last N datasets. The bars are color coded:
- Green represents the dataset has completed processing
- Yellow represents that data is still being sourced
- Red represents the process completed with an error
This graph is useful to see trends in data volume to detect faulty execution and anomalies in how much data is being sourced.
Topics in this section: