You can find all available datasets in a report through the Datasets page. Datasets are arranged chronologically with the most recent ones at top. Datasets are timestamped to indicate when they were extracted. They are also color-coded to indicate their status - green denotes proper completion, orange denotes the extraction is in progress and red denotes extraction completed with one or more errors.
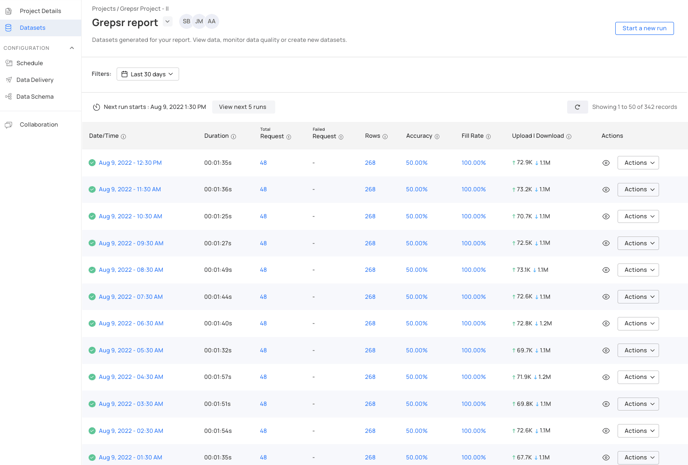
Fig: A list of datasets in a report
You can click on the dataset to view its underlying data. Some important quality metrics are also bubbled up so trends can be easily analyzed and problems are identified at glance. Additionally, you can click on the different metrics to reveal how it has been trending.
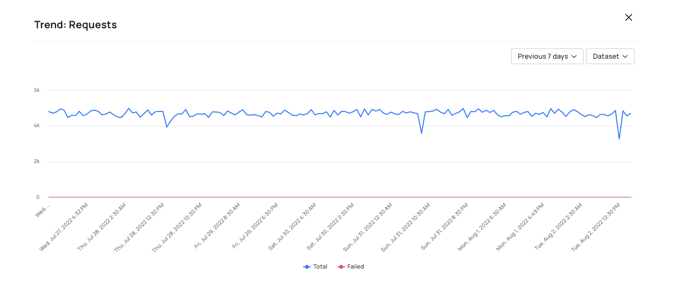
Fig: Request trend for a dataset
Topics in this section: