The Data Preview section allows you to browse through the dataset that was extracted. This is useful for running through the data to check if everything is in order.
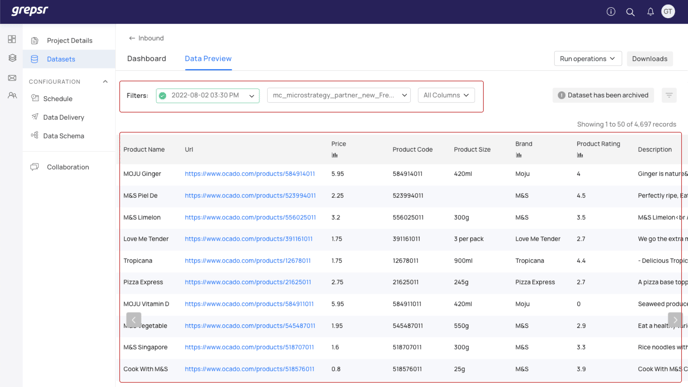
Fig: Data preview
You can navigate to the Data Preview section by clicking on a specific dataset from the Datasets page. This will load the content from the first page in the dataset. Pages in a dataset are similar to sheets in a spreadsheet. Each dataset has at least 1 page. The content of the dataset is loaded in the grid. Data is loaded 50 rows at a time since, in most cases, the intent is only to preview the data and do a sanity check rather than comb through the entire dataset.
Filters at the top of the page can be used to
- Dataset filter: this filter opens a datepicker to navigate to different dates. Dates where there is at least 1 dataset is visually distinguished. The adjacent window next to the datepicker shows a localized timestamp of the different datasets generated on the selected date. Clicking on a dataset from the list will load the associated data in the grid
- Page filer: a dataset contains at least 1 page. Pages can be used to organize the underlying data separately often in a normalized form. The page filter can be used to jump from one page to the next
- Columns filter: this filter shows the different column headers in a dataset page. All the columns are loaded by default and this filter can be used to show specific columns only
Datasets are color-coded to represent different statuses. Here is a list of the available statuses and the associated color:
- Success (green): the extraction has fully completed and the dataset was generated without any error
- Processing (orange): the extraction is still running and the dataset has not been fully generated.
- Failed (red): the extraction has completed with one or more errors resulting in an incomplete dataset
- No data (grey): the extraction has fully completed without error by the resulting dataset is empty
Topics in this section: